Inserting and Routing a Debug Core As An ECO
Context
An Engineering Change Order, or ECO, is a method that allows small modifications to be made to an existing design without needing to reimplement it from scratch. In doing so, by preserving as much of the existing implementation as possible and only making incremental changes, ECOs can save on compilation runtime.
In this tutorial, we will demonstrate how simple trace-buffer(s) can be rapidly inserted into an existing place-and-routed design and then unintrusively connected to signals of interest to aid debugging.
This trace-buffer consists of a FIFO36 primitive configured as a ring-buffer that continuously samples its 36-bit data input on each clock cycle. Once the clock is stopped, this trace-buffer will contain a 1024 cycle history of the activity on those inputs. Unloading the contents of this trace-buffer is assumed to be realized using the Readback Capture process, which leverages built-in configuration resources (as opposed to the user-programmable resources) to transparently extract the contents of the user state including the contents of block RAMs that host our FIFO36.
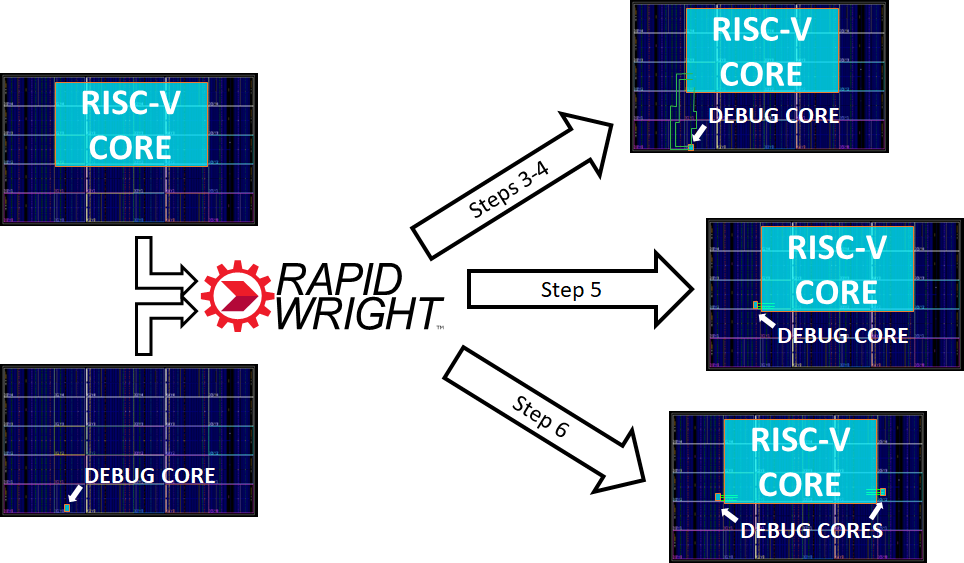
Even though this particular debug core is simplistic, the techniques described in this tutorial can be extended to more complex cores. An overview of the sections that follow is shown below:
Getting Started
1. Prerequisites
To run this tutorial, you will need:
Java 11 or later
Vivado 2023.1 or later
In this tutorial, RapidWright will be used as a precompiled library downloaded from a Java package distribution site (Maven Central).
2. Setup
Start by cloning and entering the tutorial repository:
git clone https://github.com/Xilinx/RapidWrightECO
cd RapidWrightECO
This repository contains:
The Gradle Wrapper (
gradlew) which is a script for launching the Gradle Build Tool.Gradle settings (
build.gradle) for this project, indicating what its dependencies (e.g. RapidWright) are, where to download them from, as well as the location of source files.Java sources used in this tutorial (e.g.
src/EcoInsertRouteDebug.java).Example Vivado Design Checkpoints (DCPs) for use in this tutorial.
The example design that we will be using in this tutorial is an open source RISC-V processor
core by the name of Berkeley Out-of-Order Machine
that has been placed-and-routed onto a Xilinx UltraScale+ XCVU3P device.
The configuration used (MediumBoomConfig) resulted in a design that occupies around
36,000 LUTs.
This design can be examined by opening it up in Vivado:
vivado files/boom_medium_routed.dcp
Here, the placed and routed result is shown:
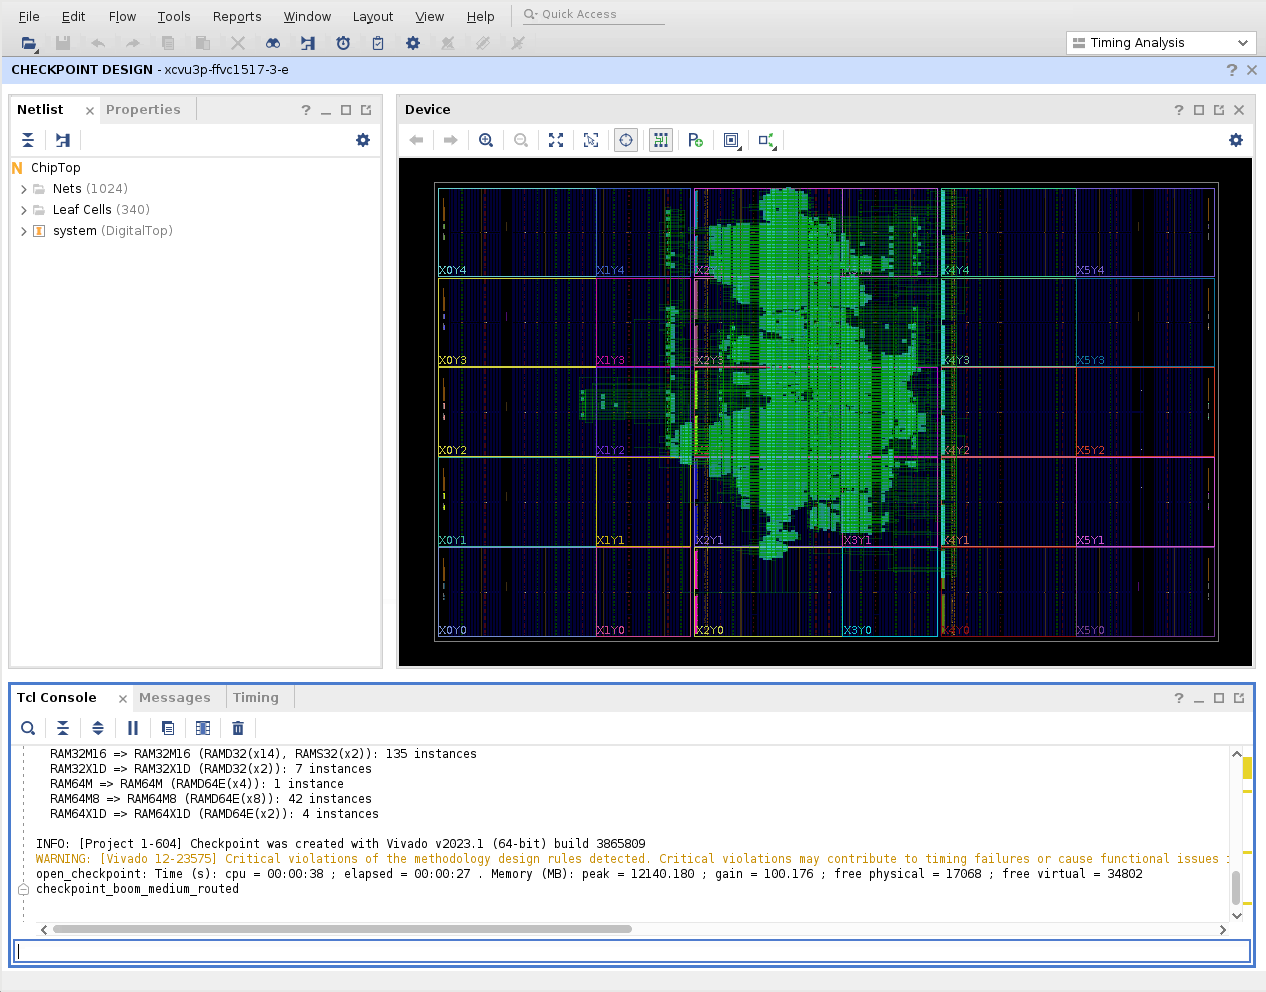
Note that only the upper-center part of the device is occupied by the user design, leaving a significant amount of free resources to aid debug.
Next, we can examine our simplified debug core by also opening it with Vivado. This debug core was generated from an RTL description and synthesized out-of-context, placed, and routed as a standard Vivado project. An out-of-context synthesis run refers to compilation of a sub-module that is intended to be integrated with a top-level design at some future time. In such a flow, for example, any top-level ports will not have I/O buffer cells inserted. Run the following command using the Tcl Console located in the lower portion of the Vivado GUI:
open_checkpoint files/fifo36_routed.dcp
A new window will appear with this design.
Although it may look like the device is empty at first, navigating to “Leaf Cells” in the
“Netlist” tab in the left-hand side of the Vivado GUI and selecting the FIFO36E2_inst
element will zoom to the FIFO36 primitive, which is located in the lower-left corner of the
device:
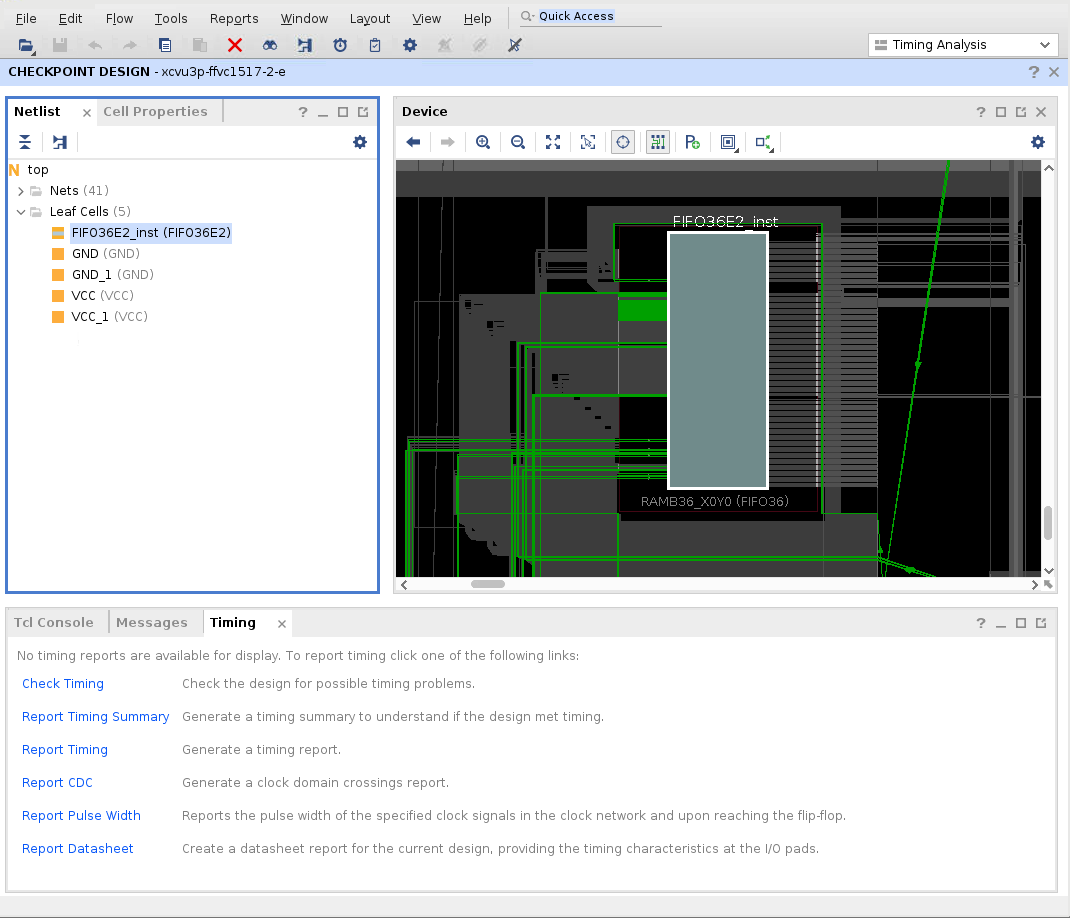
Note that this debug core contains a number of unconnected inputs (specifically, its write clock and data inputs which are to be connected later to the design under debug) as well as control inputs (e.g. write enable, sleep, etc.) that are pre-routed to VCC or GND as appropriate. In particular, GND is supplied from LUT resources situated to the right of the block RAM primitive.
Once you are satisfied with the state of both designs, please close both Vivado windows.
In the following sections, we will demonstrate how to use RapidWright to combine both the base design and the debug core into a single design in a way that preserves the placement and routing of both. Additionally, we show how to incrementally connect and re-route the signals of interest without disrupting this placement and routing, as well as how to instantiate and relocate multiple debug cores.
3. Inserting the debug core into a place-and-routed design
RapidWright will be used to merge both the base design and the debug core into a single
design without losing any of its existing placement and routing.
The Java code to achieve this is available at src/EcoInsertRouteDebug.java, the
relevant parts of which is duplicated below:
class EcoInsertRouteDebug {
    public static void main(String[] args) {
        Design baseDesign = Design.readCheckpoint("files/boom_medium_routed.dcp");
        Design debugDesign = Design.readCheckpoint("files/fifo36_routed.dcp");

        boolean unrouteStaticNets = false;
        Module debugModule = new Module(debug, unrouteStaticNets);

        ModuleInst debug1ModuleInst = baseDesign.createModuleInst("debug1", debugModule);
        debug1ModuleInst.placeOnOriginalAnchor();

        // << commented out code omitted >>

        baseDesign.writeCheckpoint("boom_medium_debug.dcp");
    }
}
This code describes a Java class with a single “main” method that serves as its entrypoint when executed.
The first two Design.readCheckpoint() calls loads the two DCPs into RapidWright’s
data structures.
Next, the design containing the debug core is converted into a RapidWright
Module
object representing a “template” that can be copied and moved into other designs.
This Module object is then instantiated inside the base design (under a level of
hierarchy named debug1) and placed at its original location.
Lastly, the newly merged design is written to disk.
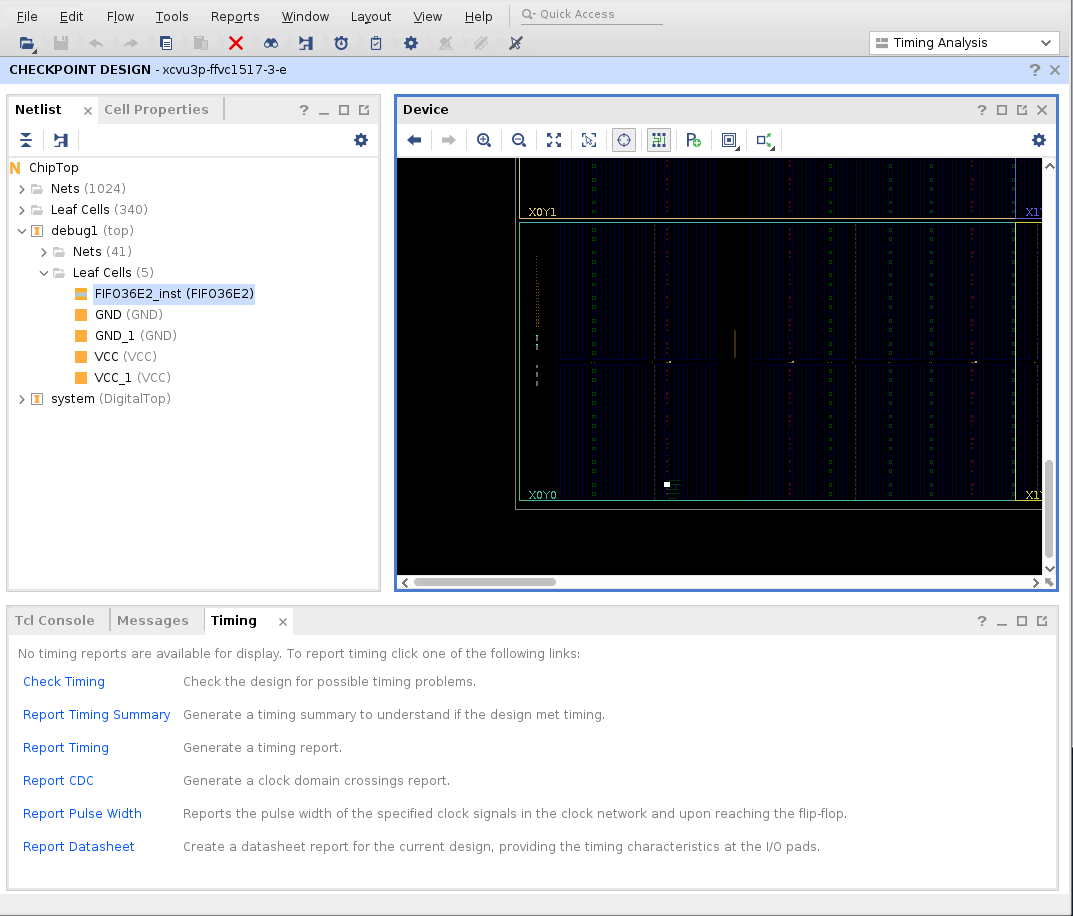
Compile and run this source code with the following command that invokes the Gradle wrapper, and then open Vivado (in the background) to examine the generated DCP:
./gradlew -Dmain=EcoInsertRouteDebug :run
vivado boom_medium_debug.dcp &
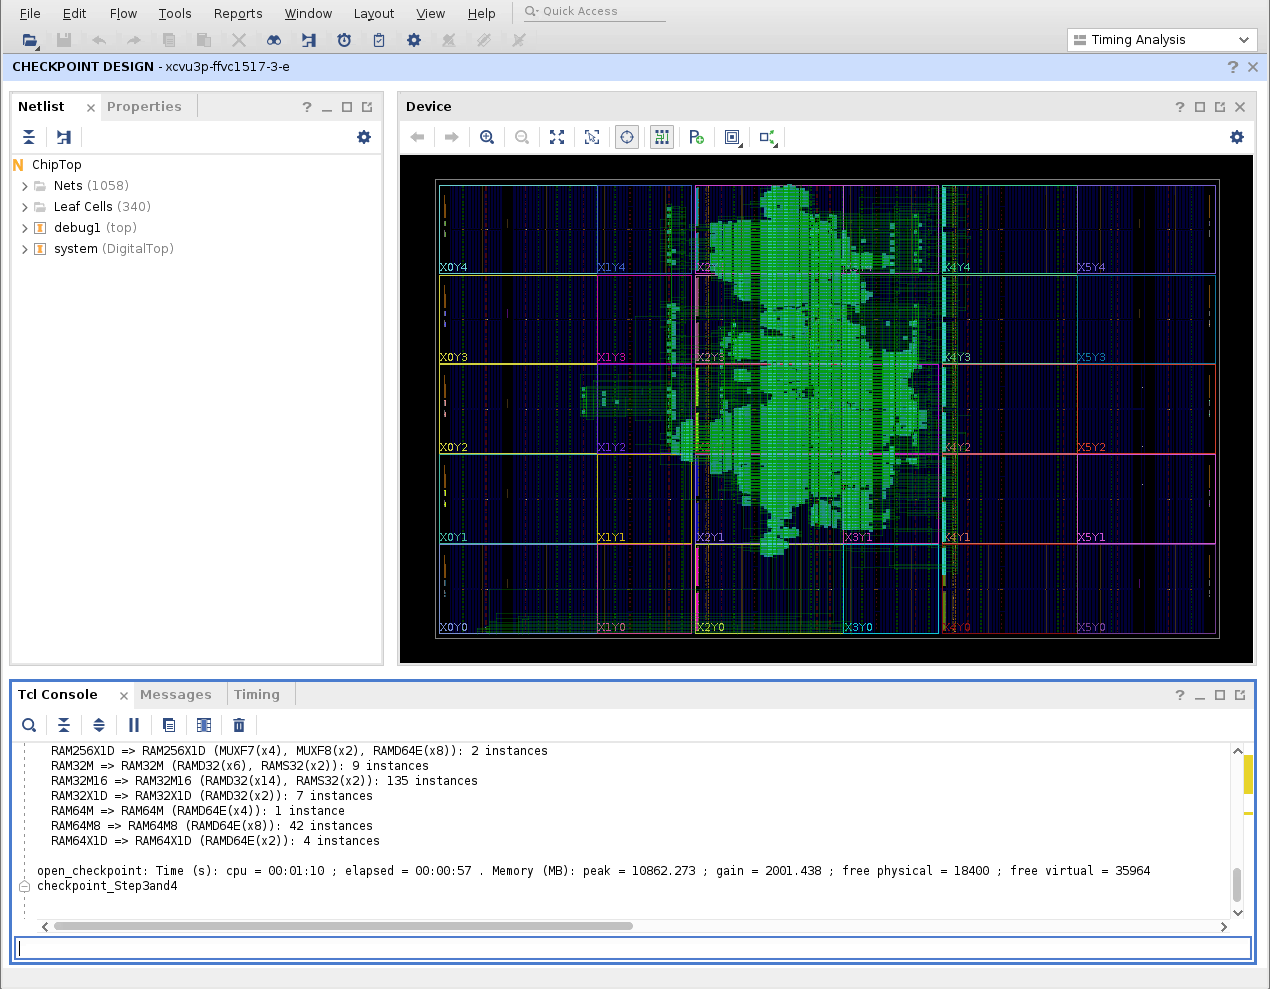
Once again, it is not immediately obvious that the debug core has been merged in with the base design; select “debug1 > Leaf Cells -> FIFO36E2_inst” from the left-hand “Netlist” tab to verify its existence and location. The following image shows the result after zooming out six steps:
To verify the state of the design,
report_route_status
can be run in the Vivado Tcl Console to give the following result:
report_route_status
Design Route Status
                                               :      # nets :
   ------------------------------------------- : ----------- :
   # of logical nets.......................... :       87712 :
       # of nets not needing routing.......... :       33882 :
           # of internally routed nets........ :       30546 :
           # of nets with no loads............ :        3299 :
       # of routable nets..................... :       53830 :
           # of fully routed nets............. :       53830 :
       # of nets with routing errors.......... :          37 :
           # of nets with no driver........... :          37 :
   ------------------------------------------- : ----------- :


Nets with Routing Errors: (only the first 10 nets are listed)
  debug1/DIN[0]
  debug1/DIN[10]
  debug1/DIN[11]
  debug1/DIN[12]
  debug1/DIN[13]
  debug1/DIN[14]
  debug1/DIN[15]
  debug1/DIN[16]
  debug1/DIN[17]
  debug1/DIN[18]
This output is reporting that 37 nets have no driver — these refer to the unconnected 36 data inputs plus its accompanying clock signal.
Please keep Vivado open as we will be reusing it in the next section.
4. Connecting the debug core
Now that the debug core has been inserted into the base design, the next step is to use RapidWright to connect and route the signals of interest from the design under debug into the debug core for tracing.
Return to src/EcoInsertRouteDebug.java and uncomment the commented lines of code to get:
class EcoInsertRouteDebug {
    public static void main(String[] args) {
        Design baseDesign = Design.readCheckpoint("files/boom_medium_routed.dcp");
        Design debugDesign = Design.readCheckpoint("files/fifo36_routed.dcp");

        boolean unrouteStaticNets = false;
        Module debugModule = new Module(debugDesign, unrouteStaticNets);

        ModuleInst debug1ModuleInst = baseDesign.createModuleInst("debug1", debugModule);
        debug1ModuleInst.placeOnOriginalAnchor();

        List<ModuleInst> debugInsts = new ArrayList();
        debugInsts.add(debug1ModuleInst);

        String clkName = "clock_uncore_clock_IBUF_BUFG";
        List<String> netNames = new ArrayList();
        for (int i = 0; i < 36; i++) {
            netNames.add("system/tile_prci_domain/tile_reset_domain_tile/core/csr/s1_pc_reg[" + i + "]");
        }
        EDIFNetlist baseNetlist = baseDesign.getNetlist();
        List<String> netPinList = buildNetPinList(baseNetlist, clkName, netNames, debugInsts);
        ECOTools.connectNet(baseDesign, netPinList);

        PartialRouter.routeDesignPartialNonTimingDriven(baseDesign, null);

        baseDesign.writeCheckpoint("boom_medium_debug.dcp");
    }
}
These new lines of code are responsible for connecting nets from the base design to the
debug core.
This includes specifying the base design’s global clock net (named clock_uncore_clock_IBUF_BUFG)
that will form the write clock of our debug core, and collecting a list of all program counter (PC) nets
in the RISC-V core (nets system/tile_prci_domain/tile_reset_domain_tile/core/csr/s1_pc_reg[35:0])
to be connected to the debug core’s data inputs.
The mapping of the each net (captured in the netPinList member variable) to its debug core input
is done in the buildNetPinList() method, which is not shown.
ECOTools.connectNet() (a RapidWright method modelled on Vivado’s connect_net Tcl API) is then
provided with this mapping and connections are made through the design hierarchy as needed.
Lastly, PartialRouter.routeDesignPartialNonTimingDriven() calls a variant of RapidWright’s
router (named RWRoute)
that will incrementally route only those newly connected pins using just unoccupied resources,
without disrupting any part of the existing place and route solution.
Re-compile and execute the modified source code by running from the terminal
./gradlew -Dmain=EcoInsertRouteDebug :run
again. Once complete, reload the design in Vivado using the following Tcl command:
refresh_design
which will reload boom_medium_debug.dcp from disk to give the following output:
Notice that there now exists routing (green lines) connecting the design under debug in the upper
portion of the device with the debug core in the lower left corner.
Running report_route_status now shows that the design contains no routing errors:
Design Route Status
                                               :      # nets :
   ------------------------------------------- : ----------- :
   # of logical nets.......................... :       87675 :
       # of nets not needing routing.......... :       33814 :
           # of internally routed nets........ :       30515 :
           # of nets with no loads............ :        3299 :
       # of routable nets..................... :       53861 :
           # of fully routed nets............. :       53861 :
       # of nets with routing errors.......... :           0 :
   ------------------------------------------- : ----------- :
5. Relocating the debug core
During the original creation of the debug core, the placer decided to locate it in the bottom
left corner of the device.
Given its distance from the design under debug, routing delays caused by connecting any signals
of interest to this debug core may cause an undesirable performance impact.
RapidWright’s ModuleInst functionality allows the debug core to be relocated to legal positions
closer to the design under debug.
For the scope of this tutorial, we will visually identify a new location for placing the debug
core but it should be noted that automated methods also exist.
Using Vivado (which should still have the last boom_medium_debug.dcp open) it can be observed
that there are free block RAM resources to the left and right of the design under debug which
would represent better locations for any debug core.
Select and zoom into the following site:
select_objects [get_sites RAMB36_X7Y34]
Note that this site is unoccupied, and that LUT resources to the right of this RAM resource are also unoccupied as they are necessary to host a number of GND sources.
Edit src/EcoInsertRouteDebug.java again, comment out the placeOnOriginalAnchor()
call and instead place the debug core at this new location, as shown below:
ModuleInst debug1ModuleInst = baseDesign.createModuleInst("debug1", debugModule);
// debug1ModuleInst.placeOnOriginalAnchor(); // Comment out this line

Device device = baseDesign.getDevice(); // Add this and the following line
debug1ModuleInst.place(device.getSite("RAMB36_X7Y34"));

List<ModuleInst> debugInsts = new ArrayList();
Re-compile and execute the modified source code by calling
./gradlew -Dmain=EcoInsertRouteDebug :run
and execute
refresh_design
inside Vivado to view this latest result. Ensure that this result is also legal with a call to
report_route_status
6. Inserting and routing multiple debug cores
A single debug core (in this example, supporting the tracing of up to 36 signals) may not
be sufficient.
Besides being able to relocate a single ModuleInst, RapidWright also supports the
creation of multiple instantiations of the same Module object.
Incidentally, the program counter of the BOOM processor is 40-bits wide thus requiring
a second debug core for full visibility.
Edit src/EcoInsertRouteDebug.java to create and place a second instantiation, then
connect that up, so that the main method looks like the following:
public static void main(String[] args) {
    Design baseDesign = Design.readCheckpoint("files/boom_medium_routed.dcp");
    Design debugDesign = Design.readCheckpoint("files/fifo36_routed.dcp");

    boolean unrouteStaticNets = false;
    Module debugModule = new Module(debugDesign, unrouteStaticNets);

    ModuleInst debug1ModuleInst = baseDesign.createModuleInst("debug1", debugModule);
    // debug1ModuleInst.placeOnOriginalAnchor();
    Device device = baseDesign.getDevice();
    debug1ModuleInst.place(device.getSite("RAMB36_X7Y34"));

    // Second instantiation and placement into new site
    // >>>>>
    ModuleInst debug2ModuleInst = baseDesign.createModuleInst("debug2", debugModule);
    debug2ModuleInst.place(device.getSite("RAMB36_X4Y41"));
    // <<<<<

    List<ModuleInst> debugInsts = new ArrayList();
    debugInsts.add(debug1ModuleInst);
    // Addition of second debug core to list of instances
    // >>>>>
    debugInsts.add(debug2ModuleInst);
    // <<<<<

    String clkName = "clock_uncore_clock_IBUF_BUFG";
    List<String> netNames = new ArrayList();
    // Increase PC from 36 bits to full 40 bits
    // >>>>>
    for (int i = 0; i < /*36*/ 40; i++) {
    // <<<<<
        netNames.add("system/tile_prci_domain/tile_reset_domain_tile/core/csr/s1_pc_reg[" + i + "]");
    }
    EDIFNetlist baseNetlist = baseDesign.getNetlist();
    List<String> netPinList = buildNetPinList(baseNetlist, clkName, netNames, debugInsts);
    ECOTools.connectNet(baseDesign, netPinList);

    PartialRouter.routeDesignPartialNonTimingDriven(baseDesign, null);

    baseDesign.writeCheckpoint("boom_medium_debug.dcp");
}
Re-compile and execute the modified source code by calling
./gradlew -Dmain=EcoInsertRouteDebug :run
and execute
refresh_design
inside Vivado to view this latest result. Again, verify the result by calling
report_route_status
and close Vivado once you are satisfied it is legal.
7. Inserting and routing debug cores without leaving Vivado
It is possible to adapt the these techniques into a standalone application to be run directly
from and integrated with Vivado.
The source code for this standalone application is located at src/EcoInsertRouteDebugApp.java
and differs from that in the prior section by accepting two command-line arguments corresponding
to the input and output DCPs to be processed, and to accept signals for tracing as marked inside
the Vivado GUI.
To build this standalone application, execute the following command:
./gradlew -Dmain=EcoInsertRouteDebugApp :fatJar
to build an all-in-one “JAR” (Java Archive) file containing all its compiled code and dependencies.
Next, create a new Tcl source file named eco_insert_route_debug.tcl with the following contents:
# Write the design
write_checkpoint -force eco_input.dcp
write_edif -force eco_input.edf
# Execute the EcoInsertRouteDebugApp.jar and display its output upon exit
puts [exec java -jar EcoInsertRouteDebugApp.jar eco_input.dcp eco_output.dcp]
# Close the old checkpoint
close_design
# Re-open the modified checkpoint
open_checkpoint eco_output.dcp
# Check design is fully routed
report_route_status
# Find all signals marked for debug and display them in a new GUI tab
show_objects -name find_1 [get_nets -hierarchical -top_net_of_hierarchical_group -filter { MARK_DEBUG == "TRUE" } ]
Lastly, launch Vivado with our original base design once again:
vivado files/boom_medium_routed.dcp
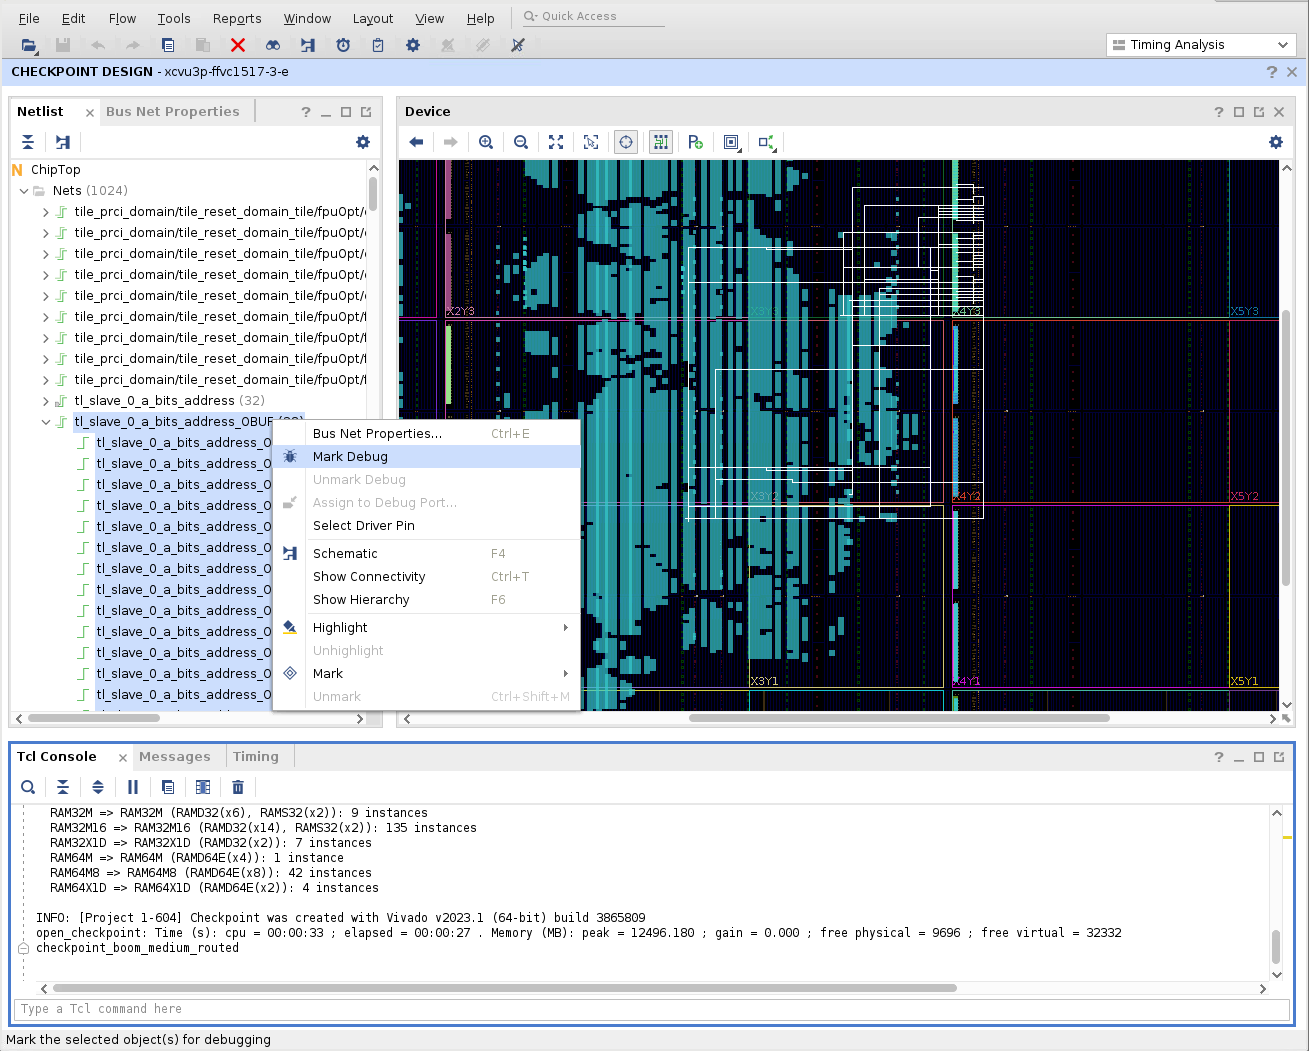
We will use the “Mark Debug” feature within the Vivado GUI to select the signals to be connected
to the debug core.
From the “Netlist” tab in the left hand side, open up the top-level “Nets” folder and right click on
the tl_slave_0_a_bits_data_OBUF (64) entry and select “Mark Debug” as shown below:
From the Tcl Console, execute the previously created script in the following manner:
source eco_insert_route_debug.tcl
As the comments in the Tcl script indicate, this causes the base design (with signals marked for
debug) to be written to disk, operated on by the EcoInsertRouteDebugApp and then re-opened
in Vivado, all without leaving the Vivado interface.
Verify that all traced nets are indeed fully routed.
8. Closing Comments
In this tutorial, we’ve demonstrated how RapidWright can be used as part of a custom application that is capable of inserting, relocating, connecting and routing one or more debug cores (trace buffers) without disrupting the existing placement and routing of the base design.
More specifically, we’ve demonstrated how RapidWright’s Module capabilities can be used
to insert and relocate designs within other designs, how ECOTools can be used to connect
nets and pins from such merged designs, and how PartialRouter can be used to incrementally
route just the unrouted pins.
Beyond those, RapidWright contains many more capabilities – for example, ECOTools
supports the ability to also disconnect pins from nets, remove cells, create new nets
and cells, etc.
Pre-implemented Modules
is a separate tutorial that discusses Module-s in more details, in which a manual
HandPlacer (with GUI) and automated simulated-annealing based BlockPlacer are both
described and could be adapted to ease the process for finding module placements.